Btc Analysis: Comprehensive Guide - Expert Tips
Published: 2026-09-25
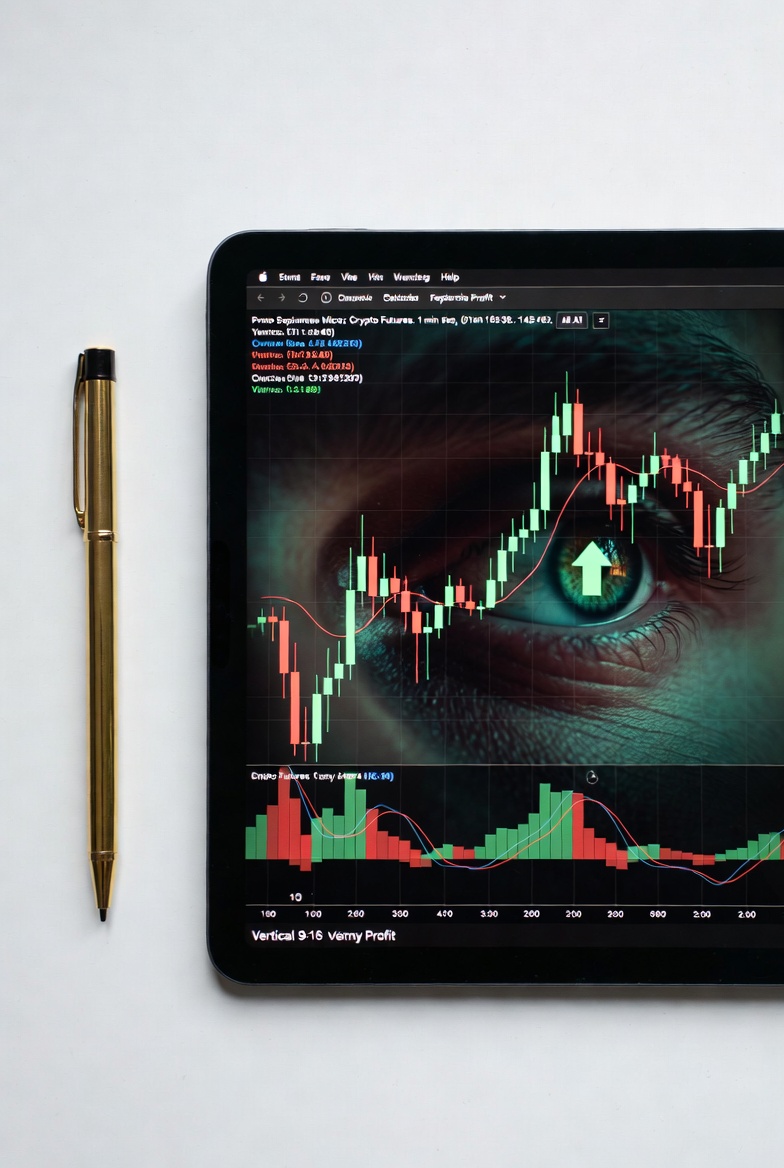
Bitcoin lost 8.4% in a single 24-hour window in August 2024, wiping out $320 million in leveraged long positions. If you held through it without a plan, you already know why BTC analysis matters more than any price prediction. This guide covers how professional traders actually read the market — and where most beginners go wrong first.
What BTC Analysis Actually Means
BTC analysis is the process of evaluating Bitcoin's price using historical data, trading volume, and market structure to estimate where price may move next. It splits into two schools: technical analysis (reading charts) and fundamental analysis (reading adoption, regulation, and supply). Neither predicts the future. Both improve your odds.
Before going further: most retail traders lose money. Studies of forex and CFD brokers consistently show 70–80% of retail accounts end in the red. Analysis reduces blind guessing — it does not eliminate loss.
Technical Analysis: Reading the Chart
Technical analysis assumes price reflects all known information and that patterns repeat because human behavior repeats. Think of it like reading weather radar — it shows where storms have formed, not a guarantee one hits your street.
Support and Resistance
Support is a price level where buying has historically stopped declines. Resistance is where selling has capped rallies. Bitcoin's $60,000 level acted as support repeatedly through 2024 before breaking in August.
Practical tip: mark levels on the weekly chart first, then refine on the 4-hour. Fewer lines means clearer decisions.
Moving Averages
A moving average (MA) smooths price over a set period. The 200-day MA is the most watched. When BTC trades above it, the long-term trend is generally up. When it drops below — as in mid-2024 — trend followers reduce exposure.
Volume and Momentum
Price moves on low volume often reverse. A breakout on 2x average volume is more credible. Momentum indicators like RSI (Relative Strength Index) measure how fast price has moved; above 70 suggests overbought conditions, below 30 suggests oversold.
Warning: RSI can stay above 70 for weeks in a strong trend. Using it alone as a sell signal has burned many traders.
Fundamental Analysis: What Moves Bitcoin Long Term
- Supply schedule: Bitcoin's issuance halves roughly every four years. The April 2024 halving cut new supply from 6.25 to 3.125 BTC per block.
- Institutional flows: US spot Bitcoin ETFs launched in January 2024 and absorbed billions in net inflows within months.
- Macro conditions: Rising interest rates typically pressure risk assets, including crypto.
- Regulation: Clearer rules tend to reduce uncertainty; enforcement actions raise it.
How to Use Trading Signals Without Getting Burned
A trading signal is an alert — often from an algorithm or analyst — suggesting a buy or sell. Signals are tools, not instructions. Blindly following them is how accounts get liquidated.
Three rules for evaluating any signal:
- Check the logic: Does it state entry, stop-loss, and target? A signal without a stop is incomplete.
- Check the track record: Ask for verified results over 12+ months, not screenshots of winning trades.
- Size positions correctly: Risk no more than 1–2% of your account per trade. On a $10,000 account, that's $100–$200 maximum loss per position.
Example: A signal says buy BTC at $62,000, stop at $60,500, target $66,000. Risk is $1,500 per BTC; reward is $4,000. That's a 2.7:1 reward-to-risk ratio — a reasonable setup. A signal with a $5,000 stop and $1,000 target is not.
Common Mistakes in BTC Analysis
- Overleveraging: 10x leverage means a 10% adverse move wipes the position. Bitcoin moves 10% in a day regularly.
- Confirmation bias: Only reading analysis that agrees with your position.
- Ignoring timeframes: A bullish 15-minute chart means little if the weekly trend is down.
- No written plan: Decide entry, exit, and size before you click buy — not after.
Building a Repeatable Analysis Routine
Consistency beats intensity. A simple daily routine:
- Check the weekly and daily trend (price vs. 200-day MA).
- Mark 2–3 key support and resistance levels.
- Review volume on the last major move.
- Note upcoming macro events (CPI releases, Fed meetings).
- Write your bias and the price level that would prove it wrong.
That last step is the most important. If you can't define what would invalidate your view, you don't have a view — you have a hope.
FAQ
Is BTC analysis reliable?
No method is reliable in the sense of guaranteed. Analysis improves probability and risk management. Losses remain possible on every trade.
How much capital do I need to start?
You can analyze the market for free. For trading, only risk money you can afford to lose entirely — many experienced traders suggest no more than 5–10% of savings in high-volatility assets.
What's the best timeframe for Bitcoin analysis?
Most traders use the daily chart for trend and the 4-hour or 1-hour for entries. Shorter timeframes produce more noise and more false signals.
Do trading signals work?
Some do, over specific periods and market conditions. Performance degrades when conditions change. Always verify with your own risk limits.
What is the 200-day moving average telling us?
It reflects the long-term trend. Sustained trading above it suggests accumulation; sustained trading below suggests distribution. It lags price, so it confirms trends rather than predicting turns.
Disclosure
This article is for educational purposes only and is not financial advice. Some links on this page may be affiliate links, meaning we may earn a commission at no extra cost to you. Trading Bitcoin involves substantial risk of loss. Past performance does not indicate future results. Consult a licensed financial advisor before making investment decisions.
Read more at https://cryptofutures.trading